Diagrams
Organize complex domain models with multiple diagrams. Each diagram can represent a bounded context, module, or logical grouping of entities.
Multi-diagram support
AeroCoding projects can contain multiple diagrams to help you organize and manage complex domain models.
Separate concerns
Group related entities together. Keep your User Management entities separate from Order Processing, making each diagram focused and manageable.
Model bounded contexts
Each diagram can represent a DDD bounded context. Generate isolated modules with their own Domain, Application, and Infrastructure layers.
Manage complexity
Break large schemas into manageable pieces. A project with 100+ entities becomes easier to navigate when organized across multiple focused diagrams.
Collaborate better
Different team members can work on different diagrams simultaneously. Real-time collaboration shows who's viewing each diagram.
Info
Creating diagrams
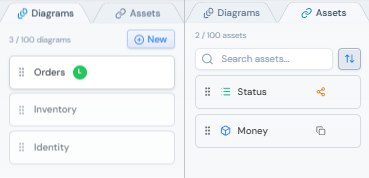
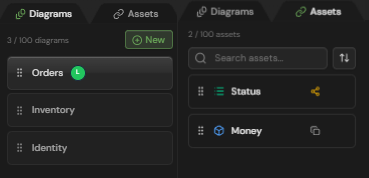
Add new diagrams from the left sidebar to start organizing your domain model.
Open diagrams panel
Click the Diagrams tab in the left sidebar to see all diagrams in your project.
Add new diagram
Click the '+' button at the top of the panel or use the 'New Diagram' option in the context menu.
Name your diagram
Enter a descriptive name like 'User Management', 'Order Processing', or 'Identity'. Use names that match your architecture documentation.
Choose a color
Optionally assign a color to visually distinguish the diagram. Colors help identify related diagrams at a glance.
Tip
Organizing diagrams
Use colors, naming conventions, and ordering to keep your diagrams organized and easy to navigate.
Assign colors
Right-click a diagram and select 'Change Color' to assign a color. Use colors to visually group related diagrams - for example, all e-commerce diagrams in blue, all auth diagrams in green.
Reorder diagrams
Drag and drop diagrams in the sidebar to reorder them. The order is preserved for all team members and affects keyboard navigation (Ctrl+1-9).
Rename diagrams
Right-click on a diagram to access the context menu, then select 'Rename'. Changes are synced in real-time to collaborators.
Delete diagrams
Right-click and select 'Delete' to remove a diagram. This action cannot be undone and removes all entities within it.
Warning
Diagrams as bounded contexts
When DDD mode is enabled, diagrams map directly to bounded contexts for modular code generation.
Automatic module generation
Each diagram generates its own module folder with Domain, Application, and Infrastructure layers following Clean Architecture.
Entity scope detection
Entities used in multiple diagrams are automatically marked as SHARED and placed in the Shared Kernel module.
Cross-context relationships
When you create a relationship between entities in different diagrams, the generator handles imports and references correctly.
Context mapping
Relationships between contexts are documented and can generate anti-corruption layer patterns when needed.
Tip
Switching diagrams
Navigate between diagrams quickly using the sidebar, keyboard shortcuts, or the diagram switcher.
Click in sidebar
Click any diagram name in the left sidebar to switch to it. The canvas updates immediately with that diagram's entities.
Keyboard navigation
Use Ctrl+1, Ctrl+2, etc. to quickly switch between the first 9 diagrams. The numbers correspond to their order in the sidebar.
Quick switcher
Press Ctrl+K to open the command palette and type a diagram name to jump directly to it.
| Shortcut | Action |
|---|---|
| Ctrl + 1-9 | Switch to diagram 1-9 |
| Ctrl + K | Open quick switcher |
| Ctrl + Tab | Cycle through recent diagrams |
Import & export
Share your diagrams, create backups, or integrate with other tools using import and export features.
Export
- JSON schema format (full data)
Import
- JSON schema format
- Database schema (coming soon)
- OpenAPI spec (coming soon)
Export single diagram
Right-click a diagram in the sidebar and select 'Export'. Choose your format and download the file.
Export entire project
Use Project Settings → Export to download all diagrams as a single JSON file. Includes all entities, relationships, and metadata.
Import diagrams
Drag and drop a JSON file onto the canvas, or use Project Settings → Import. Entities are merged with existing ones by name.
Next steps
Continue learning about domain modeling and code generation.